Borealis - Built Using Aurora
Borealis is a simple 'what-if' app that's built using solely Aurora. With this app we will demonstrate the type of beautiful UI that can be created using Aurora as an alternative to going native. Let's walk through Borealis and see some of the highlights!
Title Screen
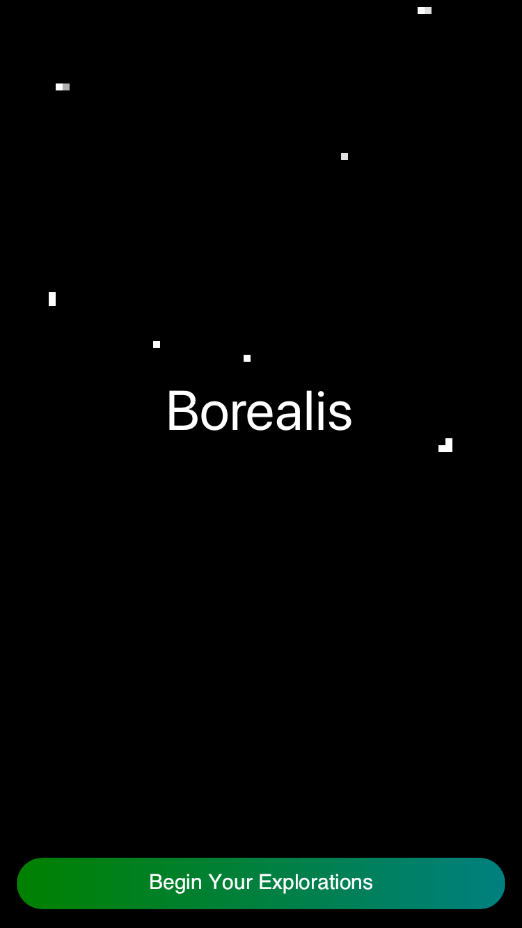
Launch the app and behold the title screen! A simple text label indicates the title of our app. Below it is a GradientPillButton with a pleasant green gradient.
The most stunning of all, however, is the background. It consists of a cleverly configured ConfettiView with black and white and pixelation filters to achieve the effect of moving through stars.
Menu Screen
The menu screen uses two Tiles for buttons. The background is a GradientColorView that animates through a set of colors and angles. This produces an effect that resembles an aurora in motion.
Explore Auroras
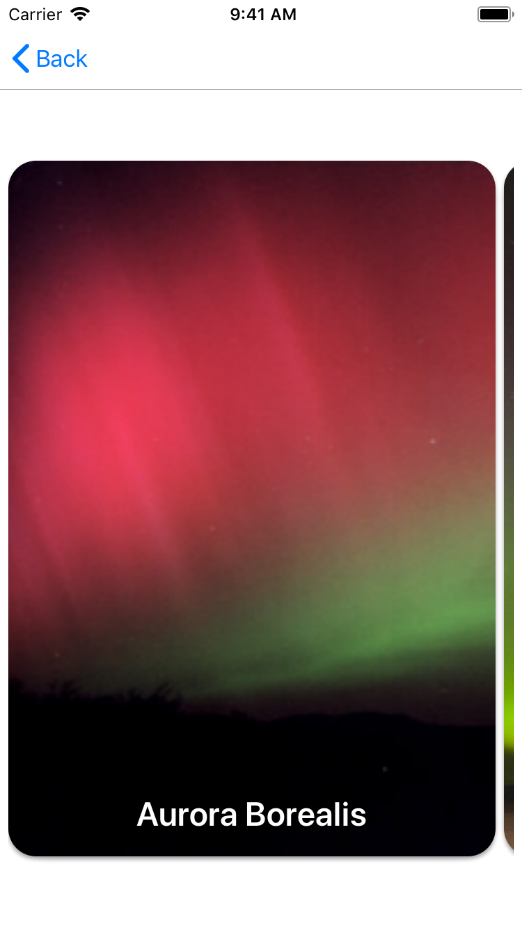
This screen consists of a view that can be scrolled horizontally and two CardViews representing Aurora Borealis and Aurora Australis. The images on the cards are pulled straight from the internet.
Aurora Detail Screen

This screen is a pseudo-details screen that shows various properties someone might observe while viewing an aurora. These are represented by six CircularGauges. At the bottom of the screen is a button that 'randomizes' the data; you can observe several changes when tapping this button:
- The Intenstiy gauge will increase in width as it becomes more 'intense'
- The background on the color gauges will become darker as the gauge fills more
Next to the randomize button is another button that takes you to the Emissions screen.
Emissions Screen
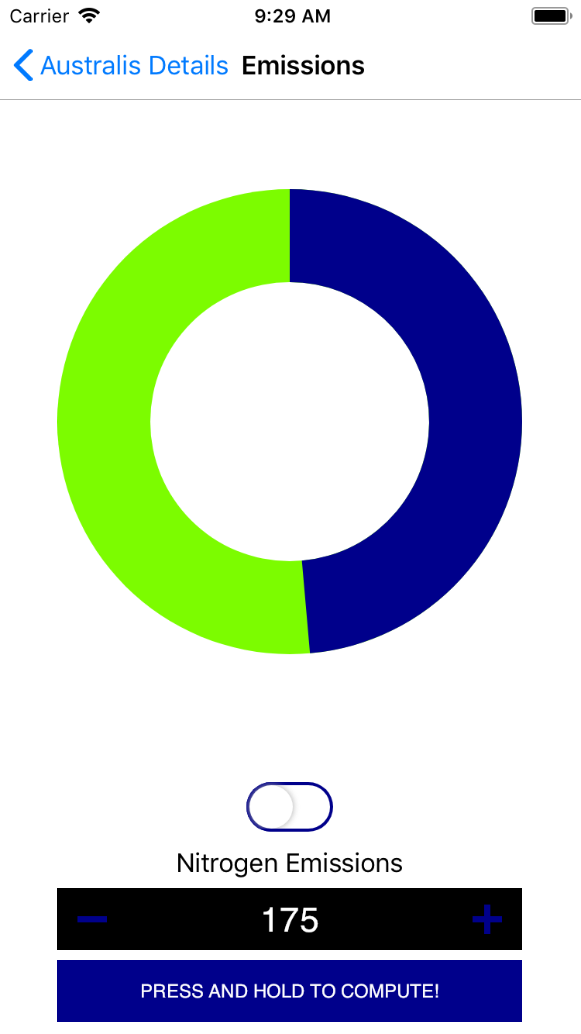
The emissions screen is designed to show the amount of nitrogen and oxygen particles being emitted and contributing to the color of the aurora. The DonutChart is the main attraction here, showing the split between nitrogen and oxygen. Beneath is a CupertinoToggleSwitch that changes colors based on what particle is being selected. Underneath that is a NumericBumper that allows the values to be manipulated. If the user presses and holds the FlatButton below, the values on the DonutChart will update via a transition.
Log Observation
This simulates an observer entering their details as they are witnessing an aurora. The workflow consists of four screens as indicated by a StepIndicator at the top of each screen. And at the bottom is a blue GradientPillButton that advances to the next screen in the workflow. There is also an option to let the camera 'detect' the colors of the aurora, if the user feels so inclined.
Use Camera to Detect Colors
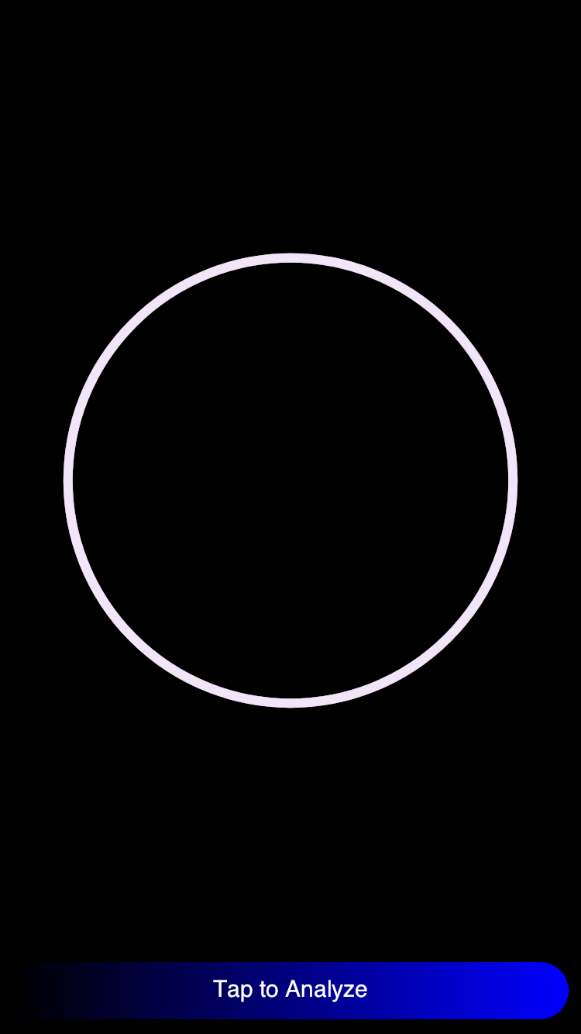
This screen uses a RainbowRing that grows in intensity of movement and color as 'detection' progresses. Detection itself can be triggered by tapping the GradientPillButton at the bottom of the screen. When finished, it will smoothly transition to green and the view will push to the next screen.
Detection Results
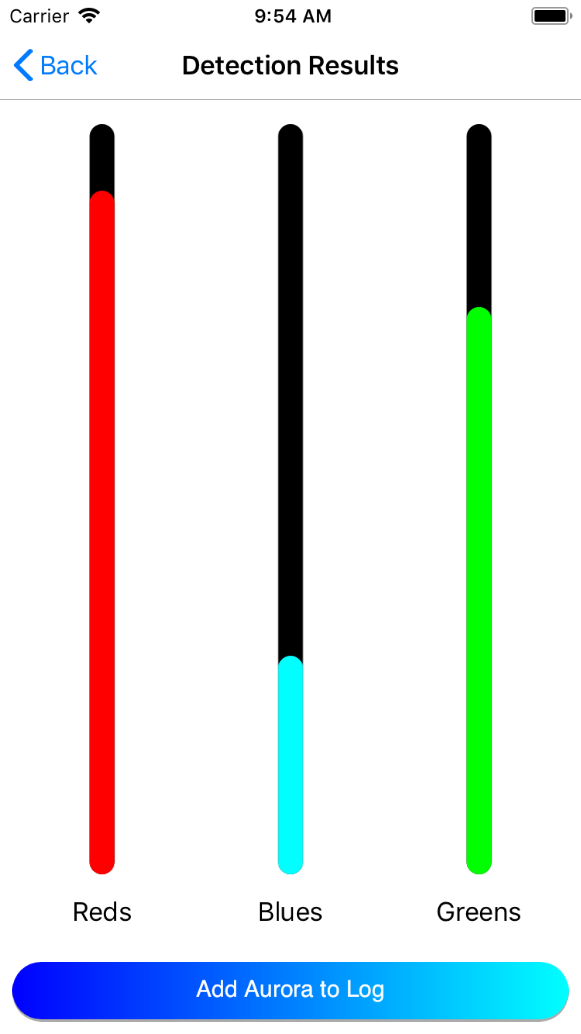
When entering this screen, the LinearGauges will animate their values into position. From there, the user can tap the button and see the save screen, after which the process will start from the beginning.
Log Time and Duration
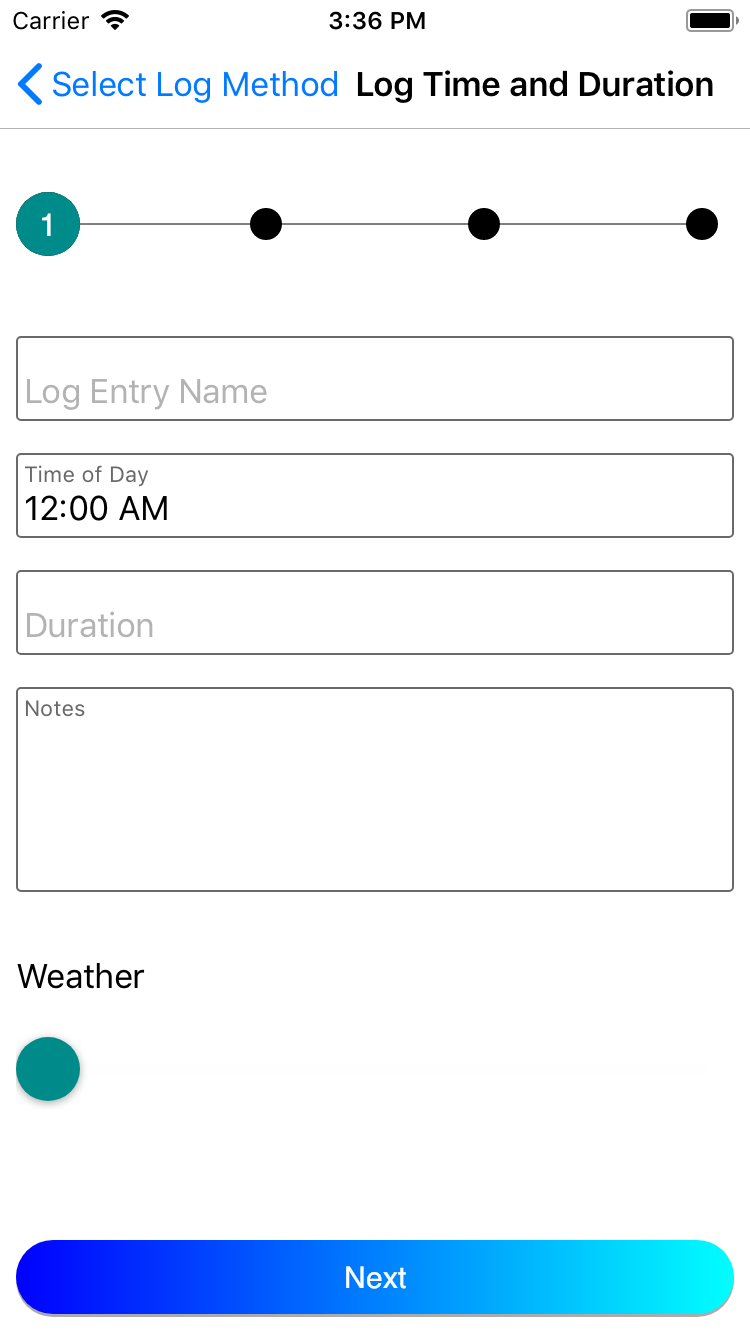
On this screen, the user can enter the time at which they have observed an aurora and the duration that it lasted. These fields are a FloatLabelTimePicker and FloatLabelNumericEntry, respectively. The label color is green when active. There's a Slider at the bottom to adjust weather value and this changes colors as it is moved about.
Log Intensity
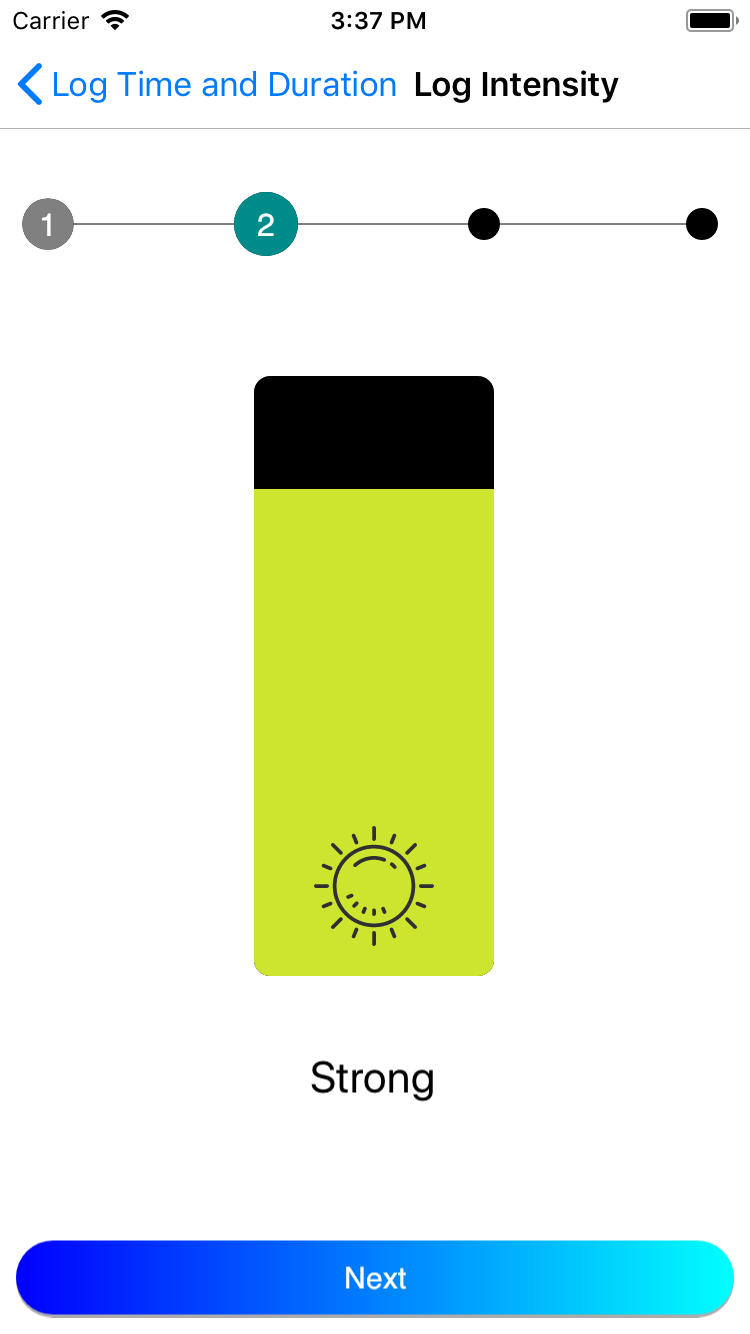
This screen gives the user a ControlPanelSlider that can be manipulated to adjust the level of intensity observed. The colors will shift as the slider is manipulated.
Log Colors
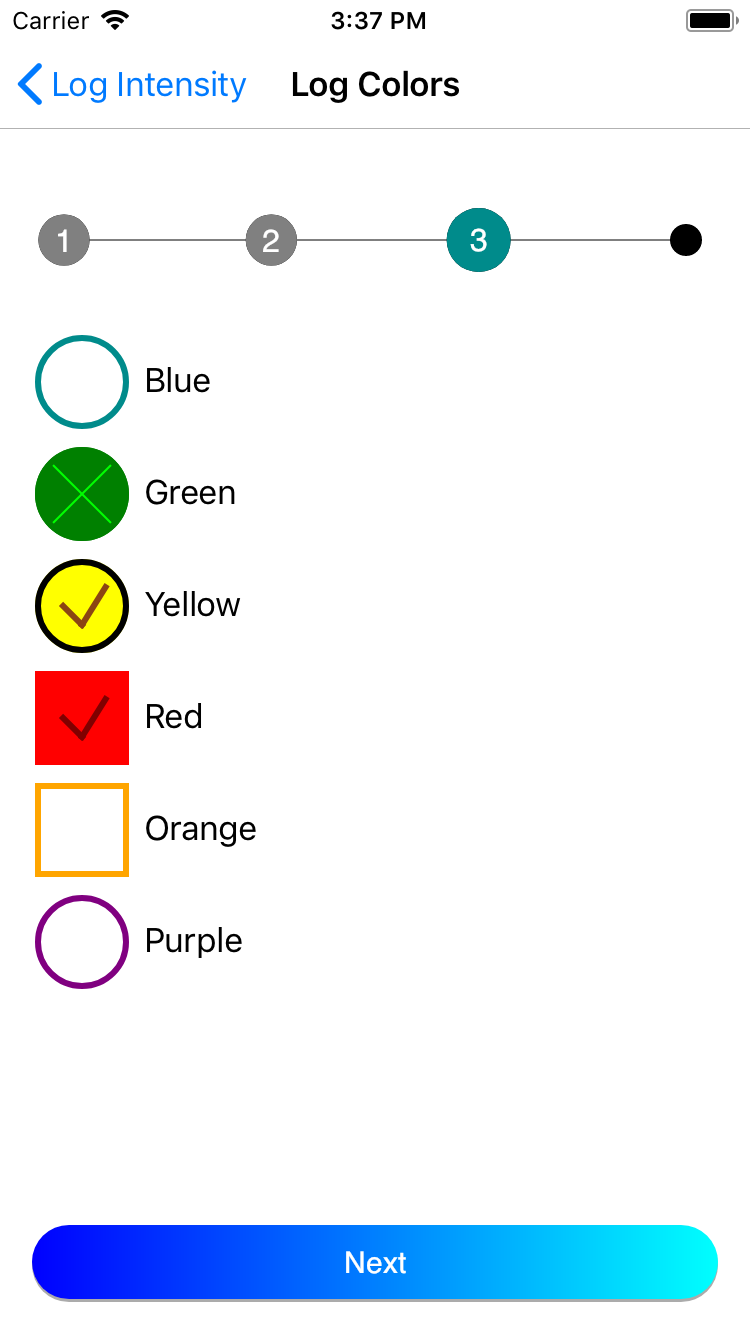
Here, the user can check the colors that they saw. These are presented to them as several CheckBox controls.
Log Signature
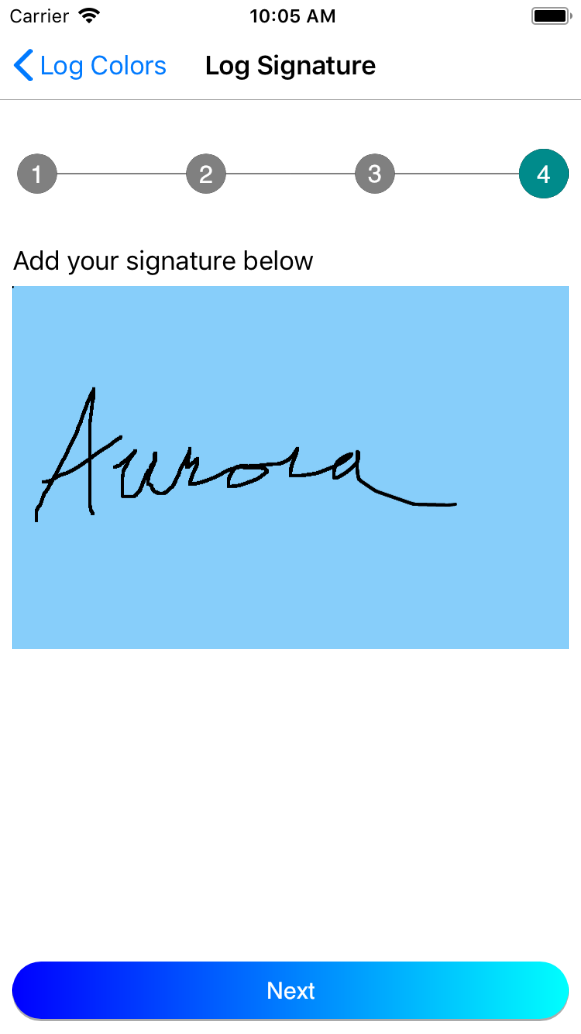
A simple Signature control is all this screen consists of. Easy to use and implement.
Saving
The final screen is a pseudo-save screen, as if the data previously entered were being saved. It's a simple Nofriendo loading view combined with a MaterialCircular loading view at the bottom.